970.530.0556

-
+
Change text size

Author

Simplicity vs. Flexibility In Your Portfolio

By Scott Roark, MBA, PhD | December 18, 2020

There is much to be said for the practice of simplifying and de-cluttering in life.  It seems like I keep seeing consultants and tools that will help you clean out and organize your garage, your food pantry, or your closet.  It seems that the hoarding gene (apparently it resides in a region on Chromosome 14) is relatively widespread among us.

It turns out that this tendency to accumulate clutter can be fairly common in the financial arena as well.  If you change jobs, move around or respond to financial services marketing, chances are that you have more accounts than are really necessary for a smoothly functioning life.  While there may be some arguments to having more than a couple of accounts for a particular category, it may sometimes be easier to keep track of financial matters when you are not dealing with endless statements at the end of each month. This logic also transfers to the actual investments that make up your multiple accounts. The financial services industry has attempted to provide simplicity with an investment vehicle called a Target Date Fund.

Target Date Funds have been marketed is as a simplifying tool for retirement savings.  They can be appealing because, in one fund, you can get a well-diversified holding that can achieve a targeted asset allocation (or at least get very close to one). The theory behind Target Date Funds is rather than having a portfolio with a dozen or more varying asset classes, one simple fund may do it all. As a quick overview of Target Date funds, they have dates contained in their name that roughly correspond to a “targeted retirement date”, often occurring in 5-year increments. Funds with a target date in their name closest to the current year will theoretically have less volatility and more fixed income and cash-like holdings in them while funds with a target date in their name furthest from the current year will be invested in a more growth-oriented manner. For example, a fund sponsor may have funds that range from a 2020 fund that might have 35% in stocks and 65% in fixed income and cash-like holdings while a 2065 fund could be allocated to 90% stocks and just 10% in fixed income and cash-like holdings.

Obviously, a full discussion of Target Date funds is beyond the scope of this simple article.  I will get into more depth on these complex funds in the future, perhaps on one of our EDU podcasts! But in terms of adding simplicity to your portfolio, they may be an attractive tool, especially in the accumulation phase of retirement planning – that period of time when you’re just adding to your portfolio every month and you are not taking any distributions.

However, in retirement when you begin sending your savings and living off them, I would argue the simplicity that Target Date funds offer starts to lose its appeal.  In the distribution phase of retirement planning investment flexibility become more valuable than account holding simplicity.  Unfortunately, that is where a Target Date fund can lose some appeal.  For instance, consider the situation of March 2020 when the Corona Virus scare had the equity markets down 30%+ in a short period of time. However, in the same period, some fixed income and cash-like holdings (not all, but some) held steady or even gained in value.  If you were taking a $20,000 quarterly distribution from your retirement funds in March, it would have been nice to pull from the fixed income or cash-like holdings that were more stable in value and had not dropped rather than selling your stock holdings which had likely dropped in value. This is where the simplicity of a Target Date fund loses out to its inflexibility.  If all your assets are in a Target Date fund, you can’t choose to sell the winners and leave the losers alone. If the Target Date fund’s “losers” dropped enough that they took the entire fund’s value down, even though the fund holds some “winners”, you must still sell the entire fund as one. There is no picking and choosing allowed!  It is the proverbial “Throwing the baby out with the bathwater” conundrum.

When you are close to, or in retirement and you are actively spending from your portfolio, I think it is better to have the flexibility that comes from breaking your actual retirement portfolio into its constituent parts.  At Jim Saulnier & Associates we call this “positioning” and it allows you the flexibility to pick and choose what holdings you sell under what market conditions.

Target Date funds and others in their ilk, do offer simplicity and can be a useful option to busy professionals lacking the time and inclination to monitor and manage an investment portfolio during their accumulation years. But in retirement, when assets must be sold to fund your spending needs, I would suggest you opt away from simplicity and begin “positioning” your portfolio for spending by utilizing separate low-cost passive asset classes in your portfolio for the spending flexibility they afford. After all, babies should not be thrown out with the bathwater!


Additional Disclosure:

Diversification and asset allocation strategies do not assure profit or protect against loss. Past performance is no guarantee of future results. Investing involves risk. Depending on the types of investments, there may be varying degrees of risk. Investors should be prepared to bear loss, including loss of principal.

Asset Allocation and Asset Positioning

By Scott Roark, MBA, PhD | November 23, 2020

Asset Allocation

One of the most important decisions investors make is the “asset allocation” decision.  This is the decision about the broad categories of investments that will be held in a portfolio.  In the broadest sense, these categories would be things like stocks and bonds.  But many times, investors also consider other categories of assets like cash, commodities and real estate and maybe even more esoteric categories like private equity, blockchain currencies (e.g. bitcoin) and vintage cars.  In this article, we’re going to stick with a mix of asset types (also called “asset classes”) that addresses the needs of the vast majority of investors – stocks, bonds and cash.  And in terms of how investors participate in these asset classes, I’m going to assume that broad based ETFs are used for stocks and bonds and a money market fund is the stand-in for cash.

There are a few important characteristics of asset classes that matter to investors, including average return, risk, liquidity and correlation. Each asset class will usually have slightly different expressions of these characteristics and several are listed below.

  • Average return reflects the expected total return of an asset is going forward. This return is made up of income and capital gains (price increases) that benefit the owner.  Over the past 100 years or so, stocks have had the highest average return, followed distantly by bonds with cash bringing up the rear.  According to the 2020 edition of the SBBI Yearbook, the average annual compound return for the various classes is:

Large-cap stocks                                 10.2%

Long-term corporate bonds                  6.1%

U.S. Treasury Bills (cash proxy)          3.3%

Inflation                                                2.9%

  • Risk reflects the uncertainty associated with returns and is frequently measured by the standard deviation of returns. The more ups and downs there are in the returns for an asset class, the higher the standard deviation will be.  From 1926-2019, stocks have been the riskiest asset class, followed by bonds and then by cash. Based on the 2020 SBBI Yearbook, the standard deviation of returns for the asset classes is:

Large-Cap stocks                                 19.8%

Long-term corporate bonds                  9.8%

U.S. Treasury Bills (cash proxy)          3.1%

Inflation                                                4.0%

  • Liquidity is really about the ease of converting an asset to cash without losing too much value in the conversion. The asset classes we are considering are very liquid.  Of more concern here is really the interaction between risk and liquidity.  It is easy to sell a stock ETF, but you don’t really want to do that when the market has tanked by 25%.  A better time to sell investments is when they have had a nice increase.
  • Correlation is the last important characteristic of asset classes that we will consider. Correlation touches on the diversification benefits of an investment – does having this asset reduce the overall risk of your portfolio?  This could also be thought of as a measure of how one asset zigs when another asset zags.

According to the 2020 SBBI Yearbook, the correlations between stocks, bonds and cash are all below 0.17 – which means they have generally contributed to diversification and reduced risk when held together in a portfolio.


Asset Positioning

The notion of asset positioning ties investing decisions related to asset allocation to spending decisions based on timing.  Many times, this is thought about as matching the timing of a known liability (spending need) to the characteristics of an asset.   Here are a few principles of matching that are commonly used in the accumulation phase of life (up to retirement):

Saving for retirement – there is a long horizon (anywhere from 20-40 years of future participation in the labor force), so a heavy dose of stocks is usually called for.  The need for a high average return to provide a sizable nest-egg and the fact that there is plenty of time to recover from a downturn means stock are an appropriate choice.

Saving for college education – this might be up to 18 years away if you start setting aside money at birth in a 529 account (use a stock-heavy allocation) all the way up to saving some money for next year when junior or juniorette starts college (use money market).

Saving for a house – if you are planning on buying a house in the next couple of years, the biggest need from an investment is stability.  If the money you’ve set aside for a down payment takes a 25% haircut from a market downturn, then perhaps the purchase decision has to be put off for quite some time.  Generally, for these needs that are imminent, setting aside money in low-risk money market accounts is best.

In retirement planning, asset positioning is also key.  At Jim Saulnier & Associates, we believe strongly in the need to position assets in such a way that spending decisions are aligned with investment decisions.  We work with our clients to move away from one catch-all portfolio to a portfolio that has been positioned with different mini-portfolios (also known as “sleeves” in our business) to meet different spending objectives.  For instance, we position clients such that they have a principal-protected sleeve for immediate spending needs (anywhere from 1-5 years of spending will be set aside in cash or cash-like holdings so that there is no risk of a market downturn causing a loss of spending power.  The drawback of this safe approach, especially in the past few months, has been the very low interest rates that can be earned on these kinds of investments.

For intermediate spending needs (from 5-10 years or more in the future), we may position clients where there is some modest level of risk, but also the opportunity to have the investments grow in value to keep up with and hopefully exceed inflation.

Because retirement can last anywhere from 10-30 years (or more), it is important to have some investments allocated to more aggressive holdings (i.e. stocks) that can continue to grow over time.

And because some needs don’t necessarily have a definite timetable attached – such as the need for long-term care – there may be sleeves set aside with a mix of immediate liquidity and longer-term growth potential.

Because of all these considerations, asset positioning is a dynamic process that requires on-going maintenance and attention.  We always want to manage investments in such a way that there is plenty of cash available for near-term spending while keeping an eye on longer term goals and needs of our clients.

Active Investing vs. Passive Investing

By Scott Roark, MBA, PhD | September 18, 2020

In this blog post, I want to talk about the characteristics of passive and active investing and how those terms relate to activities frequently associated with investing.

For a working definition, I am going to consider passive investing as the set of activities and decisions that is consistent with an investor seeking to match the performance of their benchmark.  The benchmark would be consistent with the level of risk that is appropriate for the investor – consider for simplicity a 60% equity, 40% bond (60/40) portfolio.

For active investing, a good working definition is the set of activities and decisions that an investor takes to beat the performance of their benchmark.  Again, the benchmark would be consistent with the level of risk for the investor.

Let’s talk about that most important of decisions for an investor – their asset allocation.  This is really divorced from the whole active/passive discussion – at least when talking about the strategic asset allocation.  This is a decision that is made with an eye on the risk appetite, stage in life, types of assets, amount of assets, presence of guaranteed secure income, etc.  For some people this might be a 20/80 allocation and for others perhaps it is 80/20.

While the strategic asset allocation doesn’t really touch on active vs. passive, the tactical asset allocation does.  This is where certain investors/strategists/managers will adjust their target stock/bond mix based on market conditions and more importantly where they think the market will go in the near future.  This is trying to beat the market by tweaking things.  For instance, if there has been a big run up in equities, perhaps the active investor will decrease their allocation from the target 60/40 allocation to 50/50 because the fear is that the market will have a correction and by tweaking the asset allocation, the portfolio will do better than the 60/40 benchmark.

There is another important part to this asset allocation discussion.  In the absence of rebalancing a portfolio, an investor who does nothing after a run up in equities is really making an ACTIVE decision to be overweight equities because they will most likely have a higher proportion of equity than their target allocation.  It is a bit of a paradox, but by neglecting the account, the investor is effectively making a bet that they will do better than their 60/40 benchmark.  So periodic rebalancing is actually an important part of PASSIVE investing – keeping your portfolio allocated in a way that is consistent with your benchmark.

By far the most common characteristic of investing that people think about in the active vs. passive discussion is the actual investment they are picking.  A broad-based market index like the total stock market index or the S&P 500 index is a passive approach to the choice of what to buy.  Buying a mutual fund where the fund manager is trying to uncover undervalued stocks, on the other hand, is consistent with an active approach to investing.  Typically, there is a direct cost involved here.  Passive index funds or ETFs typically have VERY low expenses (less than 0.1%).  And while the expense ratios associated with active funds have come down dramatically over the years, many of these funds are still close to 1% (or more).  These higher fund expenses typically come at a cost to the investor:  Passive funds consistently beat actively managed funds over time.  A recent Morningstar report (https://www.morningstar.com/articles/999669/busting-the-myth-that-active-funds-do-better-in-bear-markets) showed that less than 10% of actively managed large cap funds beat their passive benchmark over the most recent 10 year period ending in June 2020.  For all funds (large, mid, small, international, etc.), only 24% of actively managed funds beat their passive counterparts over that time.   The biggest reason is those fees.

There is one other critical component to the active vs. passive discussion and that is the amount of trading and attempted market timing involved.  Active investors try to time the market and are usually much more frequent traders than passive investors.  This usually leads to underperformance AND to tax inefficiency.  Study after study shows that investors who trade frequently underperform those who hold onto investments.  I’ve seen multiple reports of one particularly interesting study from Fidelity when they looked at which types of clients had the best performance between 2003 and 2013.  They found that the customers with the best performance were the ones who were dead or who were inactive (i.e. they forgot they had an account).  In other words, they were messing around with their investments – trying to time the market, buy the hot stock or guess which sector was about to take off.

While this is not an exhaustive list of all the ways an investor could try to “beat the market” (sector rotation, stock selection, interest rate forecasting, exotic investments, cryptocurrency, etc.), this hits on a few common differences between active and passive.

At our firm, we choose to use a passive approach to investing for a few reasons.  First, it has been shown over time to do well in comparison to benchmarks.  Jim has talked repeatedly in podcasts and we’ve had a number of blog posts that touch on the importance of benchmarking and the passive approach holds up well when comparing to the gold standard of performance.

Second, passive investing is a tax-efficient way to invest.  By minimizing trading, capital gains and the associated taxes are kept low.

And importantly, passive investing is relatively easy to implement and monitor.  With periodic rebalancing it is pretty easy to “set it and forget it” and look up after 5 or 10 years and be surprised at how well an account has performed – how much an account has grown (if you are in the accumulation phase) or how well an account has held up (if you are in the harvesting phase).

Why Investor Returns Usually Fall Short of Benchmarks

By Scott Roark, MBA, PhD | July 17, 2020

In podcast episodes and in past blog posts (10/25/2019, 4/20/2019) we’ve talked about the importance of benchmarking – comparing the investment performance on a risk-adjusted basis to an objective measure.

At Jim Saulnier & Associates, we use five Morningstar benchmarks that are adjusted based on risk tolerance.  The benchmarks are for Conservative portfolios (20% equity, 80% fixed income), Conservative Growth portfolios (40% equity, 60% fixed income), Moderate portfolios (60% equity, 40% fixed income), Moderately Aggressive portfolios (80% equity, 20% fixed income) and Aggressive portfolios (95% equity, 5% fixed income).  The Morningstar benchmarks we use consist of around 15-18 individual holdings that are a mix of domestic equity, international equity, large cap, small cap, mid-cap, long-term bond, intermediate bond, short term bond, international bonds, REITs, TIPs, etc.

We have designed our five “Convenience” portfolios to mimic these Morningstar benchmarks.  Jim has repeatedly stated in podcast episodes and in meetings with clients that we do not expect to beat the benchmark, but instead we fully expect to trail the benchmark to at least a certain extent. The reason is that there are several factors that act as a “headwind” for the investor and can mean their performance will not match the performance of the benchmark.  Below is a discussion of the biggest factors.  While this list is not an exhaustive list of everything that can hinder performance, it will touch on the main reasons that an investor might not see the same returns as the benchmark returns they are tracking.

Fee

The most obvious reason that an investment generally lags a benchmark is the fees involved.  These would include, but not necessarily be limited to, fees on the mutual fund or ETF that is used, fees from an investment advisor, fees paid to a broker-dealer and brokerage wrap fees.  A quick example with worst case numbers will quickly show why performance might lag a benchmark by quite a bit.

Assume that you have a relationship with a financial advisor that charges an Assets Under Management (AUM) fee of 0.75% per year.  This advisor outsources investment management to a 3rd party who creates a portfolio that is consistent with the risk tolerance of the client.  This investment manager would also charge a fee – let’s assume 0.40% per year.  Finally, there are likely fees in the mutual funds or ETFs held in the investment account.  Let’s assume that the funds are actively managed funds and that the fund fees are close to the average for large-cap stock funds and are equal to 0.85% per year.  All together these fees add up to 2.0%.  This means that if the investments earned 6.0%, you netted only 4.0% after paying the fees.  Even if the investment choices were perfectly aligned with the benchmark, you as an investor would trail the benchmark by 2% per year because of these fees.

Timing

Even if fees were not part of the equation (there are funds and ETFs available now that are 0% fee index funds), there are still reasons your performance may trail a benchmark.  The timing of the investment additions or cash withdrawals will affect the performance.  If you are dollar cost averaging and making additions to your investments each month, then the part of returns that occur later in the year have a bigger impact then the part of returns that occur earlier in the year.  The reason is that you have more money in your account being affected by the return.  Say the return for January is -3% and the return for December is +3%.  If you have been adding money along the way, you will have more invested by the time December comes around and it will help your “dollar-weighted” performance.

On the other hand, if you are in retirement and making consistent withdrawals then the sooner bad returns happen, the worse it is for you.  This is the whole idea behind sequence of return risk (see 08/02/2019 blog post).

Regardless of whether you are adding money or withdrawing it, the simple fact that you have cash flows coming in or going out will cause the returns you experience in your account to be different from the benchmark which assumes that the only additions would be from reinvested dividends or interest.

Investment Composition

A third reason your returns might not match a benchmark is that the particular investments you have don’t exactly match what is in the benchmark.  This might easily happen if a large-cap fund manager for an actively traded fund has different sector weights than the S&P 500 index (which we’ll assume is the appropriate benchmark).  Perhaps she even holds the same 500 stocks as the S&P 500 index.  She just holds them in different proportions than the index.  If she is “overweight” the good performers, her fund will outperform the benchmark (assuming her fees don’t eat up all the difference!).  On the other hand, she might have decided to be overweight in the sectors that are lagging and her fund performance will be worse than the index.  The difference that is there is the result of differences in the individual holdings in the fund compared to its benchmark.

This might also happen if one is comparing the performance for a conservative allocation fund to a conservative benchmark (like the Morningstar Conservative model portfolio).  Perhaps the conservative allocation fund manager has decided to be 24% equity and 76% fixed income as compared to the 20% equity, 80% fixed income in the benchmark.  In this case, if equities outperform fixed income, this fund will do better than its benchmark.  It will have a different composition, it will entail more risk, but it will compare favorably to its benchmark.

Rebalancing

Yet another reason that investment performance in your account might be different from its benchmark is due to rebalancing.  Typically, a benchmark will involve systematic rebalancing to determine performance.  For the Morningstar portfolio benchmarks that we use the rebalancing occurs on a monthly basis.  If a particular investor’s account isn’t rebalanced on the same schedule, this could again create differences in performance over the course of a year.

Taxes

The final reason I’ll mention in this post relates to taxes.  This is more of a stealthy reason for performance difference because taxes are rarely if ever paid out directly from the investment account.  However, if there are dividend payments or interest income or capital gains distributions that occur in a taxable account, there will be an increase in the tax amount an investor pays because of these gains.  This is effectively reducing the performance of the account compared to its benchmark where the returns reported are not affected by taxation.

For all the reasons listed, and probably a few more that aren’t listed, it is unlikely that your investment performance will match the performance of the benchmark you have chosen.  But it is important that you understand how big the difference is and what is causing the differences.  Are you being killed by fees?  Is your investment selection very different from your benchmark?

The goal at the end of the day is that your performance over time is close to and perhaps slightly lower than the performance of the benchmark.  However, ideally you would see a very high correlation between your performance and the benchmark’s performance.  That will mean that you have invested in a way consistent with your goals.

Investing Risks

By Scott Roark, MBA, PhD | June 5, 2020

In all of life, we face risk.  Some of these risks are for possibilities that are extremely remote (lightning strike, shark bite, lottery win).  And in many cases, we can effectively eliminate these risks (don’t play golf in a thunderstorm, don’t swim in the ocean with a papercut and don’t buy lottery tickets).

In the investing arena, there is risk as well.  Many people equate the stock market with risk – and there is certainly a fair amount of risk in that world.  But there is also risk involved in buying bonds (even treasury bonds!) and even in having ultra-safe holdings like money market funds or CD’s.  In the space below, I’ll briefly discuss a (non-exhaustive) list of risks that are faced by everyday investors and I’ll finish by discussing proven ways to manage these risks.

Risks Faced By Stock Investors

Without a doubt, there are sizable risks faced by investors who purchase stocks or stock funds.  Among these are the following:

  • Market risk/Macroeconomic risk – this is risk faced by all equity investors and is related to the overall market climate. If the economy moves from expansion to recession, most firms will feel the effect and have poor returns as a result.  Interest rate changes, oil price shocks and legislative changes (tax code) can have broad impacts on the economy in general and on stocks in particular.  These risks are most easily seen when most firms in the market take a drop together.
  • Industry specific risk – this is the risk that companies in a particular industry will be hurt by some factor. For instance, if the price of oil increases significantly, then industries that have fuel as a significant input will be especially hit.  If jet fuel prices increase dramatically and for a long period, the share price of airlines will likely be hurt much worse than companies in general.   These kinds of risks are most easily seen when many companies in a particular industry drop together – and they drop much more than the overall market.

Other examples of industry specific risk might be litigation risk, where lawsuits have a negative impact on the entire industry.  Think of tobacco settlements or a class action lawsuit that puts a big dent in a firm’s share price.

  • Company-specific risk – this is the risk that something will happen to an individual company that causes its price to drop, even while other companies might do well. An example might be a CEO who is arrested for embezzlement and whose company’s stock takes a dive.  The rest of the market isn’t likely to be affected by this one person’s criminal activity so the decline in the share price of this company may be quite isolated and really stand out.

Risks Faced by Bond Investors

While generally the risks faced by bond investors are lower than for stock investors, there are still sizable risks that bond investors must face.  Among the biggest risks are these three:

  • Default risk – this is the risk that the borrower will not pay some or all of what they have agreed to pay. This is largely reflected in the credit rating that a bond will have.  If it is a “junk bond” (known more generously as a “high-yield bond”), there is a higher risk of default compared to an “investment grade” bond.  The bonds with the lowest default risk are U.S. Treasury securities.

When companies go through hard times, the likelihood of default and bankruptcy goes up.  In the past month, there have been several firms that have filed for bankruptcy and whose bonds have been adversely impacted.  If you own a JC Penney bond, it is a virtual certainty that the bond won’t pay all the promised interest payments or pay back the face value of the bond upon maturity.

  • Interest rate risk – this is the risk that interest rates will change in a way that hurts the value of the bond. For most bonds, this risk is really about interest rates going up.  When that happens, the value of a typical bond goes down (bond prices and interest rates move in opposite directions).  How much the value of a bond will move based on interest rate changes is frequently estimated by looking at a bond’s “duration”.  This can be frequently found by looking at a financial website.  Bonds (or bond funds) with higher duration will be more impacted by interest rate changes.

Consider two types of bond funds – one a “short-term” bond fund (with a relatively low duration) and one an “ultra-long” bond fund (with a very high duration).  At the time this is written (in mid-May 2020), the year to date change in value of short-term bonds has been an increase of about 3.5% because interest rates have fallen this year.  However, ultra-long bond funds have gone up close to 30% over the same time frame.  If interest rates had increased by the same amount, then these bond funds would have fallen by 3.5% and 30% respectively.  Long-term bond funds are definitely not without risk!

  • Reinvestment risk – this is the risk that interest rates will decrease and when a bond matures, it will be reinvested into a bond with a lower interest rate and so interest income will decrease. This particular risk has been a persistent one over the last 10+ years – where interest rates are so low that generating income from bond holdings is increasingly difficult.

Risks Faced by Savers

Even people who save money and buy CD’s or money market funds aren’t immune from risk.  While it is true that they don’t face default risk (especially if there is FDIC insurance or government backing of money market funds), they do face one especially nasty risk:

  • Inflation Risk – this is the risk that price levels will increase over time which erodes the value and purchasing power of money. Even at a relatively low level of 2% inflation, there is a significant deterioration in purchasing power over a 30-year retirement horizon.  If inflation averaged 2% per year for 30 years, things would cost about 80% more in 2050 than they do in 2020.  And as retirees probably understand, just because overall inflation is 2% doesn’t mean that the specific goods and services you consume will have the same inflation rate.  Healthcare has had a higher inflation rate – and if healthcare inflation averages 5% for 30 years then something that costs $500 today will cost over $2,160 by 2050.

If the returns from your investments/savings aren’t keeping up with inflation, then you are losing purchasing power and you are worse off in the future – even if your account balance hasn’t gone down.

With all these risks to consider, it might be daunting to think about investing at all.  But by diversifying your holdings (spreading your investments among stocks, bonds and cash), you can mitigate these risks.  A diversified portfolio doesn’t eliminate the risks, but they are definitely reduced.  Stock values will tend to increase by more than inflation over long periods of time.  Bond holdings will tend to reduce the overall volatility of a portfolio that includes stocks.  And having some cash is always a good thing – you can use it to pay for things without having to sell holdings that may have gone down in value for the time being.

Investment Management: Cost Basis Choices in the Drawdown Phase

By Scott Roark, MBA, PhD | April 17, 2020

When it comes time to start living off the investment accounts you’ve spent a lifetime building up, there are some choices that can help you manage your taxes.  The rest of this article presumes that you have taxable brokerage investments – such as stocks, ETFs or mutual funds that are not part of retirement accounts.  Of course, any distributions from a retirement account, such as an IRA or 401k, will be taxable as ordinary income and the only choice you have is how much to withdraw.

In a taxable account, however, there are some other considerations.  This is because any time you sell a holding, the IRS will want to know what the tax consequence of that sale is.  There are three possible scenarios:

  • The first possibility is that you sell some shares of your investment for exactly the same price that you paid for those shares. In this case, there is no taxable gain or loss and so there is no effect on your taxes.  All the proceeds of the sale are available for whatever use you desire.
  • A second possibility is that you sell some shares of your investment for less that you paid for those shares. In this case, you have a loss that can be used to offset gains on other investments you sell or the loss can offset up to $3,000 of otherwise taxable income.
  • The third possibility is that you sell some shares of your investment for more than you paid for those shares. In this case, you have a capital gain.  Depending on how long you have held those shares, you have either a short-term capital gain (taxed at your ordinary rate) or a long-term gain (taxed at lower rates).

With those scenarios as background, there is one important choice you can make with your brokerage account that can help you manage your tax situation.  That is the choice on the cost basis.  The cost basis refers to how much was paid for a particular share.  In many accounts, particularly those with mutual funds where distributions from the mutual fund company are reinvested, there are many different transactions that occur over time.  For instance, if you purchase 1000 shares of an S&P 500 index on January 1 and you have elected to have any distributions from the fund reinvested, there will likely be four additional purchases of shares in your account over the course of a year.  This is because many of the S&P 500 firms pay dividends and these are passed through to mutual fund owners – usually on a quarterly basis.  In addition, many investors make periodic purchases by adding new money to an account over time.  So in any account with mutual funds, there are likely a rather large number of separate transactions to buy shares.

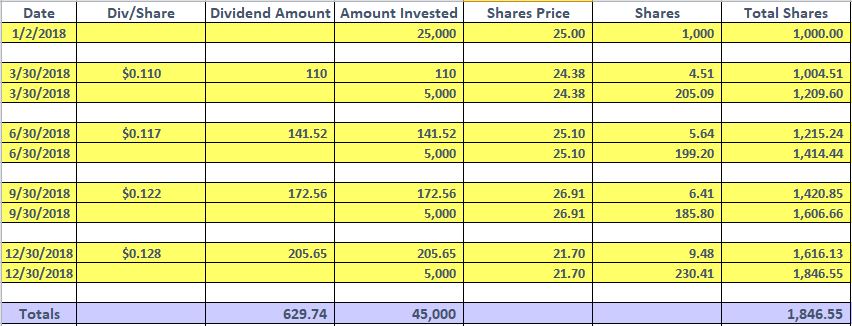
Because these shares have been purchased at different times throughout the year, there is likely a different purchase price (and cost basis) for each transaction.  In the example outlined above, there is the initial purchase, the quarterly reinvestments and the quarterly additions of new money.  In all, there are nine transactions in this simple account.  Let’s walk through the spreadsheet below and look in more detail at these transactions.  We will need this example in order to make sense of the choices an investor has when we discuss these choices later.

Here is a numerical example (roughly modeled on 2018 when there were sizable fluctuations in the market over the year):

Jan 2 – Investor makes an initial purchase of $25,000 for $25.00 per share.  The investor has a total of 1,000 shares.
Here is a numerical example (roughly modeled on 2018 when there were sizable fluctuations in the market over the year):

Mar 30 – The investor receives a dividend of $0.11 per share.  This is $110 and they can reinvest and get 4.51 shares at the new price of $24.38.  In addition, the investor puts in $5,000 of new money in and gets 205.09 additional shares.  The new share total is 1,209.60.

June 30 – Dividend of $0.117 per share.  The dividend is $141.52 (equal to 1209.60 shares x $0.117 per share).  This is reinvested at the new price of $25.10 and results in 5.64 new shares.  In addition, the investor puts in $5,000 of new money and gets 199.20 shares for a new total of 1414.44 shares.

Sept 30 – Dividend of $0.122 per share.  The dividend is $172.56 and at the new price of $26.91 per share, the reinvestment results in 6.41 new shares.  The investor also adds $5,000 of new money and gets 185.80 new shares for a total of 1606.66 shares.

Dec 30 – Dividend of $0.128 per share.  With the share total of 1606.66, the dividend is 205.65 and after a deterioration in the share price, the dividend reinvestment results in 9.48 new shares (at the new price of $21.70 per share).  With the addition of $5,000 of new money, the investor also gets 230.41 additional shares.  The total shares at the end of the year is now 1,846.55.

The total invested over the year comes in 3 flavors:  the initial purchase (of $25,000), the additional contributions of $5,000 per quarter (total of $20,000) and the reinvested dividends which total $629.74.  The cumulative invested over the year is $45,629.74.

Now to the choice you can make to help manage taxes.  There are 3 main alternatives to determining the cost basis of the mutual fund shares you sell from your taxable account:  average cost, FIFO and specific share identification.

  • Average cost means that all of the shares are treated as coming from one big bucket and the cost basis for each share is the average price paid for all the shares in the bucket (including any reinvested dividends or capital gains). In the example, this would mean the average cost per shares is $45,629.74 ÷ 1846.55 shares = $24.711 per share.  Whenever a share is sold, its cost basis will be considered $24.711 per share.
  • FIFO is short for “First In, First Out”. This means that the oldest shares are sold first.  In the example provided, any number of shares sold up to the initial 1000 purchased will have a cost basis of $25.00 per share.  After those first 1000 shares are sold, the next 209.60 shares will have a cost basis of $24.38 per share.  After that will be 204.84 shares with a cost basis of $25.10, etc.
  • Specific share identification means that you tell your brokerage firm which shares to sell – you “specify” the shares. The cost basis for the shares you sell will depend on which shares you specify.  You have some shares that have a cost basis of $25.00, some at $24.38, some at 25.10, etc.

Here is how your choice of cost basis makes a difference.  Let’s say you needed $10,000 on February 1, 2020 – when the share price of your S&P 500 index fund is $29.80 per share.  You will need to sell $10,000 ÷ 29.80 = 335.57 shares to get that money.

If your choice of cost basis is Average Cost, then for each share you sell, you will have (29.80 – 24.711) in capital gains.  In this case the total gain is $1,708 and you would pay long-term capital gains rates on this for your taxes.

If your choice of cost basis is FIFO, then for each share you sell, you will have (29.80 – 25.00) in capital gains.  In this case the total gain is $1,611.

If your choice of cost basis is Specific Share Identification, you have more flexibility.  If you want the lowest possible tax hit, you can choose to sell the highest cost shares first.  In this case, you still need to sell 335.57 shares and you can do that by selling 192.22 share you bought at $26.91 per share and sell the remaining shares (143.35) which have a cost basis of $25.10.  In this case, your gain will be only $1,229 – potentially saving you a few hundred dollars in taxes in the current year.

One quick point worth mentioning here.  If you sold ALL of the shares in any given year, the amount of the taxable gain will be EXACTLY the same.  The only thing that is changing when you select different methods is the timing of the taxes.

The big takeaway from all of this is that investors have a choice as to which cost basis method they use.  The default is likely the Average Cost Method or the FIFO method, depending on your brokerage firm.  However, the Specific Share Identification Method provides the most flexibility in managing your tax situation when selling shares from your brokerage account.  In order to change methods, you likely only need to go online and make a selection of “Specific Share ID” and you are set.  Then when it comes time to sell some of your holdings, you select which shares to sell in order to best manage your tax situation.

Re-Balancing Your Portfolio: Part 2

By Scott Roark, MBA, PhD | December 20, 2019

Re-Balancing with Numbers

In a recent blog post, I discussed the importance of re-balancing and how it fits into the spending phase of retirement.  In this article, I want to look at some specific re-balancing with numbers and how it has worked out over the past 5-15 years.  The numbers I put together actually go back 17½ years, but that doesn’t sound quite as nice as 5, 10 and 15-year horizons.  Nevertheless, in the table showing the summary results, I will include the 17½ year results as well.

Key Assumptions

In any re-balancing evaluation, there are a few key assumptions needed.  One is how often a re-balance will occur.  In this case, I did it every six months – at the beginning of each year and mid-way through each year.  Another key assumption is what you are starting with and, when considering the spending phase of retirement, what your regular withdrawal is.  I assume a $1 million initial account balance, with a 4% annual drawdown, paid out twice a year.  I further assume annual inflation of 3% over the analysis.  Given that all of these are assumptions, that means all of these could be argued about and fussed over, but they provide a reasonable starting point for the discussion.

Mechanics

Next for the mechanics of re-balancing.  For a portfolio, you start with a target allocation (for instance 45% US stocks, 15% international stocks, 30% US bonds and 10% international bonds) and at re-balancing, you buy or sell enough of the holdings to return to the target allocation.  For instance, if we assume a starting point of January 1, 2002 and look at a re-balance six months later, one will see that the broad stock market in the US declined by about 14% and an index of international bonds increased in value by about 11.5%.  In terms of re-balancing, because the US stocks have declined and the International bonds have increased, this will mean that the allocation has moved away from the target.  In order to return to the target allocation, one would sell some International bonds and buy some US stock funds – in just the right proportions to get you back to your desired allocation.

Model Portfolios

Before I get to the numbers, one last piece of description is needed.  Over a 17½ year window, I considered five different portfolios which closely mirror five model portfolios from Morningstar.  The five portfolios are Conservative (20% equity/80% fixed income), Conservative Growth (40% equity/60% fixed income), Moderate (60% equity/40% fixed income), Moderately Aggressive (80% equity/20% fixed income) and Aggressive (95% equity/5% fixed income).  While the equity and fixed income are the two broad asset classes, we use 5-6 low cost index funds in each portfolio to get exposure to subsets of the two broad classes (e.g. international bonds and international stocks).  Based on the asset allocation, these model portfolios reflect increasing risk moving from Conservative to Aggressive and they would also reflect increased expected return.

Now to the Numbers

Over a 17 ½ year window starting in January 2002, the Conservative Portfolio held up well.  The ending value of the portfolio was about $1,040,000 and it paid out the twice-a-year drawdowns without any issues.  The lowest account balance was $962,000 and occurred in July 2002 (right after “retirement”).  With the financial crisis of 2008-2009, the portfolio held up well – going from a high point of $1,075,000 in January 2008 to a low point of $970,000 in January 2009[1].  During that short window, the portfolio paid out over $48,000 in drawdowns as well.  In all, the portfolio made payments of over $900,000 (the starting point was $40,000 per year, but that grows with inflation!) over the 17 ½ year horizon.  Finally, the standard deviation – a measure of how volatile the portfolio value was – was $46,889.  In all, it was a relatively smooth ride for the Conservative portfolio since January 2002.  In the table below, I show some key metrics for the 5, 10 and 15-year intervals as well.

Metric 5-Year Window 10-Year Window 15-Year Window
Ending Value[2] $984,000 $1,230,000 $1,097,000
Low Point $925,000 (Jan 2019) $1,064,000 (Jan 2010) $972,000 (Jan 2009)
High Point $991,000 (Jan 2015) $1,232,000 (Jul 2014) $1,160,000 (Jul 2014)
Amount Paid[3] $214,000 $462,000 $751,000
Standard Deviation $22,098 $60,531 $51,694


That is a lot of numbers to digest – and we’ve only considered the Conservative portfolio!  The big takeaways I see here are the fact that the Conservative portfolio acted like it should – it maintained a relatively stable value (relatively low standard deviation) and it largely kept up with inflation by maintaining most of the principal and paying out an inflation adjusted $40,000 per year.

In the interests of space, I am going to conclude this blog post with a look at the other extreme – the Aggressive portfolio.  It is made up of 95% equity with 5% in fixed income so we would expect it to be much more volatile over time.  With the 17 ½ year horizon, this portfolio is much more affected by the tail end of the market downturn from 2001-2002.  With a retirement modeled as happening on January 1, 2002, the Aggressive portfolio takes an immediate dive down to $800,000 by the start of the next year.  However, the market recovered and the portfolio value went inexorably up – moving to $1,550,000 by July 2007 – all the while providing money for drawdowns.  Of course, there was a rather large correction in 2008-2009 and the portfolio again took a dive – this time down to $880,000 (as measured in January 2009).  Over the last 10 years, however, this particular portfolio has enjoyed a very healthy, if bumpy, ride up and the highpoint of $1,941,000 is reached with the ending value  (as of July 2019).  Of course, with each new day it seems that there is a new record for the stock market, so this portfolio – currently – is sitting pretty.  But there was a price to be paid for all the growth – the volatility was breathtaking over the past 17 ½ years.  The standard deviation over that time in the portfolio value was $313,618.  Below is the table showing the other time horizons for the Aggressive portfolio.

Metric 5-Year Window 10-Year Window 15-Year Window
Ending Value[4] $1,155,000 $2,311,000 $1,739,000
Low Point $925,000 (Jan 2016) $1,109,000 (Jul 2010) $762,000 (Jan 2009)
High Point $1,155,000 (Jul 2019) $2,311,000 (Jul 2019) $1,739,000 (Jul 2019)
Amount Paid[5] $214,000 $462,000 $751,000
Standard Deviation $83,519 $379,450 $257,067


There are a couple of things to point out with these numbers as I conclude.  First, it is apparent that the 10-year window is the best for this portfolio – which makes a great deal of sense.  We’ve had a (largely) uninterrupted run up in equity values over the past 10 years – minor corrections notwithstanding (the standard deviation tells the tale of the bumpiness involved).  This portfolio was far more volatile than the Conservative one – as it should be.  But with that came a much higher ending value – especially when one considers longer horizons.

I’ll plan on one more blog post on this re-balancing topic and we’ll look at what happened with the Conservative Growth, Moderate and Moderately Aggressive portfolios there.

[1] The low point is as of re-balance dates – not the absolute lowest point over the life of the portfolio.
[2] The initial value is always assumed to be $1,000,000.
[3] The amount paid is based on an assumed 4% withdrawal rate (i.e. $40,000 per year) starting at the appropriate time.
[4] The initial value is always assumed to be $1,000,000.
[5] The amount paid is based on an assumed 4% withdrawal rate (i.e. $40,000 per year) starting at the appropriate time.

Re-Balancing Your Portfolio: Part 1

By Scott Roark, MBA, PhD | December 6, 2019

Good discipline in investing is important in the years leading up to retirement – the accumulation phase of retirement planning.  It is important not to get too carried away if the market is going well by thinking stocks will move inexorably up.  Since March 2009, it feels like that has been the case and there are a number of investors who have come of age in the current bull market and all they know is up, up, up (interrupted briefly by small dips on the way to the next high).  But at the same time, investors can’t get carried away if the market has a correction by thinking here comes a repeat of 2008.  Re-balancing your portfolio – and having a balance of perspective with that – is important.

That is no less true in the retirement years – the spending phase.  It is just as easy to get carried away in either direction – either euphoric expectations of permanently rising markets or a melancholic belief that the next recession is just around the corner.  Either perspective can be dangerous and lead to investing behaviors that don’t serve retirement well.  Being too aggressive in a portfolio allocation can cause mayhem – especially if a correction like the one in late 2018 washes away 19% of the market value of stocks.  But being too cautious can also limit retirement spending.  In many cases, retirement will last 20-30 years or more and the “go-go” phase of retirement can last from 8-20 years or more depending on when retirement happens.

A commonly used tool to help smooth the ride, both in the accumulation phase and the draw-down phase of retirement, is re-balancing your portfolio regularly.  This act of selling assets and asset classes that have increased in value and buying assets and asset classes that have lagged can help a portfolio over the long term meet the goals that an investor has.  A disciplined approach to re-balancing your portfolio is a nice counterbalance to the temptation to engage in market timing that hurts so many individual investors.  Study after study shows the futility of market timing – where investors jump in because they think things are about to take off or sit on the sideline waiting for the next big drop.

I recently came across a podcast (not the Retirement and IRA Show ®) from 2017 where investors were fretting about a market top and the high probability of a correction in the near future.  Going back and looking at what has happened since the March 2017 podcast reveals some big missed opportunities:  the S&P has gone from around 2,350 to around 2,950 as I write this.  That’s a 25%+ increase and doesn’t include an additional 5% or so in dividend yield.  Clearly, someone who thought the market was too high in March 2017 would be leery of buying today.

Now I should include a quick comment to assure any readers that I understand that the market did not move in a straight line up over the past 2 ½ years.  There were clearly bumps along the way, including a rather disconcerting plummet in the fall of 2018.  But an investor with a longer horizon (even someone in retirement) doesn’t have to sweat these changes too much if there are a few things that are true about their portfolio:

  1. They have an appropriate balance in their portfolio of fixed income investments, equity investments and principal protected assets. The worst thing for a retired investor to face is a big hit from sequence of return risk where they need to liquidate investments for current expenses and those investments have taken a large drop in value.  Having a diversified portfolio means that an investor can liquidate some holdings that haven’t experienced a drop to fund expenditures.
  2. They have re-balanced regularly – selling winners along the way and buying more of the laggard. In a roaring bull market, that means regularly paring back the exposure to the volatile stock market and picking up more fixed income securities.
  3. They have a buffer asset – perhaps equal to 1-2 years of expenses. The presence of an asset that is liquid and principal protected that can cover expenses over a 12-24 month horizon should give a lot of security to an investor and allow them to stay the course, stay invested and not try to time the market.  If they’ve gone a step further and bucketed for a longer period of time (6-10 years), there is no good reason to worry about a market drop and no real benefit to trying to time the market.  While the most recent drop in the market in the fall of 2018 just took a few months to turn around, even the gut-wrenching fall of the great recession was largely recovered in 3 ½ years (from a high Oct 2007, the S&P recovered to within 10% of its high by Feb 2011) and was fully recovered in 5 ½ years – by Feb 2013.

In a future article, I will look at each of our Convenience Portfolios and examine how they performed over various time frames for a retiree who stuck with the portfolio, re-balanced regularly (every six months) and drew down money.  The examples will show that sticking with a portfolio, staying invested and regularly re-balancing your portfolio goes a long way towards reaching goals in a portfolio.

Measuring Portfolio Performance

By Scott Roark, MBA, PhD | October 25, 2019

Jim and Chris spent some time discussing benchmarking in a recent Q&A podcast episode. It may be helpful to get in writing some more of the important ideas around this critical aspect of investment management.

Measuring Portfolio Performance

It is critical that a benchmark is used, because without benchmarking there is no objective measure of portfolio performance.  In virtually no other area of life would you accept that – so why would an investor (or an advisor) not measure portfolio performance?  There are a few reasons, and none of them are very good from an investor’s perspective:

  • The performance of the portfolio is lagging an appropriate benchmark. This simply means that the investments are underperforming – that an investor is not doing as well as a benchmark.
  • The comparison of an investor’s portfolio with a benchmark will highlight the impact of an advisor’s fees on a portfolio’s returns. One of the uncomfortable truths of paying advisor fees (along with other fees) that are between 1-2% is that those fees are a direct drag on the performance of your portfolio.  In a world where you might expect a portfolio’s performance, without fees, to generate 5-6% per year, a 1% fee means that 15-20% of the gains you might otherwise have are gone.  And if you have 2% in combined fees, now you’re losing 30-40% of your potential returns over the long-term.
  • Using a benchmark might raise difficult and uncomfortable questions. Especially if the answers to those questions are found in reasons 1 and 2 above.  But there are other reasons a portfolio might lag a benchmark that aren’t as bad.  And an advisor should hopefully be willing to address those questions with a client who is interested.  Some other reasons a portfolio’s performance might be different than an appropriate benchmark is the fact that benchmarks are devoid of economic reality.  That is, the benchmarks typically do not include custody fees, taxes, trading fees, management fees, advisory fees and they assume frequent rebalancing and an otherwise static investment amount.  So if you are putting money in, or taking money out of your investment you will differ.  If you have to pay trading fees or taxes, your performance WILL be below the benchmark.

What Else to Consider

So when you benchmark, what is it that you are really trying to determine – or what do you really care about as an investor?  There should be things beyond just the return that your portfolio is earning.  While that “headline number” catches a great deal of attention, there are other considerations that should be addressed as well.  First among these is the risk of your individual portfolio compared to an appropriate benchmark.  If you think you are a conservative investor with a conservative portfolio, but find out that your standard deviation and your beta are more consistent with a moderately aggressive portfolio then you know you are taking on too much risk.  There has been a disconnect between what you wanted and what you have.

Another measure that is important in benchmarking is a correlation coefficient (also called “R-squared”).  Without getting too technical, this scaled measure shows how closely two items move together over time.  So having a high R-square (above 95) means that a portfolio is tracking its benchmark pretty closely.  If you have a low R-square (maybe 50-60), then that is an indication that you have two very different things.  If you are trying to mimic a conservative allocation fund, but your R-squared measure with a conservative benchmark is 50, then you are doing a poor job of matching.

At our firm, we track performance by comparing to benchmarks for our five convenience portfolios.  We have the following portfolios that vary by the risk associated with their asset allocations:  Conservative, Conservative Growth, Moderate, Moderately Aggressive, and Aggressive.  Each of these portfolios has different characteristics and different risks.  When a client chooses one of these portfolios, they should expect performance that closely matches the performance of the benchmark.  Of course, there will always be SOME differences, but understanding the differences is key for any investor.

Using Tracking Difference to Analyze Performance

By Scott Roark, MBA, PhD | August 30, 2019

Benchmarking vs. Tracking Difference

In a recent podcast episode (Edu #1925), we talked about benchmarking investment performance.  It is important for investors to know how well they (or their managers) are doing with the investment decisions they make.  One of the reasons that managers may not like to benchmark is that historically, relatively few managers consistently beat their benchmark.  There are a variety of reasons it is difficult to beat a benchmark.  Benchmarks are typically tied to an index which means it is a passive investment choice.  The problem with an index is that you can’t technically invest in one – when you buy an S&P 500 ETF, you are buying something that is very close to the index, but not the same as the index.  An index doesn’t have trading costs, taxes, manager fees, rebalancing costs and a variety of other possible drags on performance.  But you can generally feel pretty good when you buy your ETFs because the correlation between it and the index you are trying to mimic is usually higher than 99%+.

A similar way of stating the performance of an ETF and an index are very close is to look at their tracking difference (the difference between the index performance and the fund/ETF performance).  A good ETF or index mutual fund will have a very low tracking difference – measured in 1/100ths of a percent.  So for example, say the Russell 2000 index had a return of 7.59% and your Russell 2000 ETF had a return of 7.52%.  The tracking difference, in this case, would be 0.07%.  If you are trying to mimic the performance of an index by purchasing ETFs or mutual funds, the tracking difference is an important piece of information.

Using Tracking Difference

There are dozens of funds and ETFs (from dozens of fund companies) that track the S&P 500 for instance.  An investor might reasonably expect that when they purchase an S&P 500 fund, they will be getting a performance that very closely resembles the results of the S&P 500 index.  With many funds, that is what you are getting – something that very closely resembles the S&P 500 and has a tracking difference of 0.10% or less.

However, there are funds – typically ones with high expense ratios – that have relatively high tracking differences and really aren’t giving investors what they should be expecting.  One notorious example of an S&P 500 index fund has an expense ratio above 2.3%.  Compare this to many funds and ETFs that track the S&P with expense ratios of less than 0.1% and you can start to see why the fund’s returns will be well below the benchmark and there will be a large tracking difference.

What Else to Consider

In closing, I’ll mention one last factor that is related to investment performance – particularly for mutual funds.  That is the tax-efficiency of the fund.  This is related to the buying and selling of the fund and how that affects the taxable distributions from the fund each year.  If you are holding your investments in a tax-advantaged or qualified account (an IRA/401k/Roth), you may not care that much about this.  But in a taxable brokerage account, taxes represent a very real decline in investment performance.  The fund I mentioned above that had expense ratios (for an index!) over 2.3% also had an annual turnover of 157% (versus 4% for more well-run index funds) – there was a lot of buying and selling.  All this trading means that come tax time, there will likely be insult added to injury and the after-tax performance will be VERY far away from what the index return was.

Page: 1 2 »