970.530.0556

-
+
Change text size

Author

Retirement Planning and Sequence Risk

By Scott Roark, MBA, PhD | August 2, 2019

What Is Sequence Risk?

Sequence risk is an important notion in the world of retirement planning.  It refers to the risk that the sequence of returns in an investment portfolio will negatively impact the ability of the portfolio to deliver sufficient payouts throughout retirement.  In extreme circumstances, sequence risk may even mean a portfolio runs out of assets too soon.

Let’s look at the past 20 years of returns (including reinvested dividends) for the S&P 500 for example1:

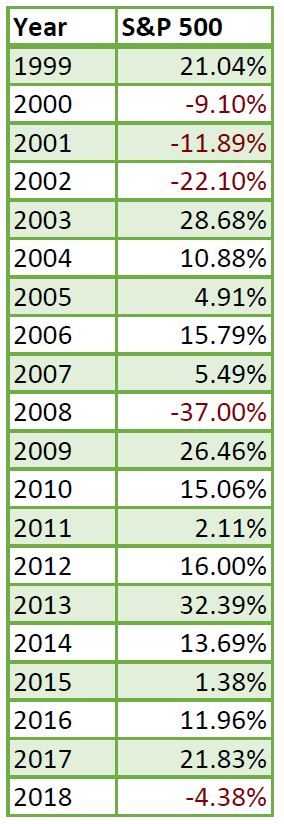
The average rate of return for these 20 years is 7.16%.

Now consider the exact same returns, now with the returns occurring in the reverse order1:

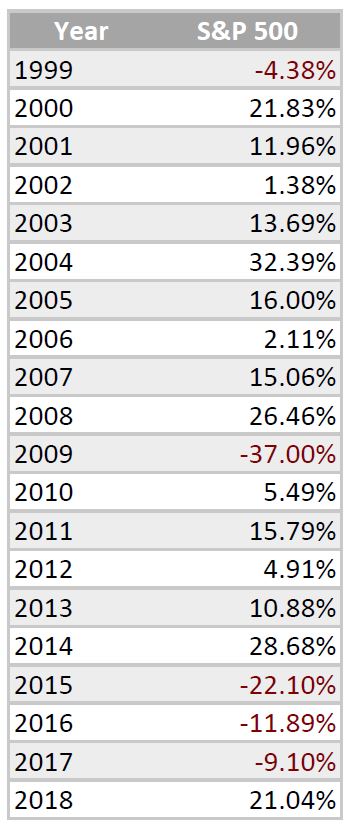
The average rate of return for this hypothetical, alternate set of returns is also 7.16%, exactly the same as for the original set of returns.  With a static portfolio (where you are neither putting money in nor taking money out), you would have the exact same ending portfolio value under either scenario.

However, if you are in retirement and withdrawing from the assets, the sequence of returns has a dramatic effect on the portfolios.  Assume that you have a $1,000,000 at the start of retirement and that you will take out $40,000 at the start of the first year (4% withdrawal rate) to support your annual spending.  Each year, your withdrawal will increase by inflation (let’s assume 2.5%) to cover the increased costs of the goods and services you consume.

For the actual series of returns from 1999-2018, you would end up with a portfolio value of about $660,000.  For the hypothetical reverse order returns, the portfolio value after 20 years would be about $1,460,000 – more than twice as large as before.  Keep in mind that NOTHING has changed except the order of returns that the market experienced.  This gives some indication of the power of sequence risk when a portfolio is being consumed.

To take the example one step further, let’s pretend that retirement started not 20 years ago – but 19 years ago in January 2000 (right when the market was about to enter a three-year tailspin).  We’ll still start with $1,000,000 and still withdraw 4% of the account ($40,000) in the first year and then grow that amount by 2.5% inflation.  Now that portfolio has shrunk to $318,000 after 19 years.  And if we had accidentally decided we could afford a 4.6% withdrawal rate back in 2000 ($46,000 for that first year’s withdrawal) – the account would have hit $0 with our 2018 withdrawal.  On the other hand, our “alternate universe” portfolio – with the reversed returns – would have ended 2018 with over $1.5 million using the same set of assumptions.

The Lesson For Retirement Planning

Given these relatively straightforward assumptions, you can see how big of an impact the series of returns can have on a portfolio.  While there is never really a good time to have a bad year of returns, the sooner the bad returns happen after retirement, the worse it is for a portfolio.

There are a host of interesting observations one can make looking at historical returns, in considering different portfolio constructions (100% bonds, 50% bonds/50% stocks, 100% stocks) and different withdrawal rates.  One of the important takeaways (which we may explore further in a future post) is the importance of having some principal-protected assets for the early years of retirement along with a well-diversified portfolio.  Those two components of a retirement plan go a long way towards mitigating the dangers of sequence risk.


1Sources: https://ycharts.com/indicators/sp_500_total_return_annual ; https://www.slickcharts.com/sp500/returns

Portfolio Diversification and Asset Correlation

By Scott Roark, MBA, PhD | July 5, 2019

What is Correlation?

Correlation between asset returns is an important consideration when you are managing portfolio diversification.  Correlation is a statistical measure of the relationship between items. An easy example to understand is the correlation between height and weight.  Usually, when height increases, weight also increases and you have what is called a “positive correlation” – these two things tend to move together.  An example of a “negative correlation” would be between the speed you drive and your gas mileage.  Typically, the faster you go, the lower your gas mileage.

How Does Asset Correlation Relate to Portfolio Diversification?

For your portfolio, the goal is to have a well-diversified collection of assets.  To be well-diversified means that you need assets that are “negatively” or not highly correlated with each other.  When one asset “zigs”, hopefully you have another asset that “zags” and when you put the two together, you have a less volatile (less risky) portfolio.

There is one important implication of this idea in terms of your investment holdings – it is not usually a good idea to have a large portion of your portfolio in your company’s stock.  This is because two of your largest assets – the large position you have in the stock AND the “human capital” you have tied up in the company through your employment can be highly correlated.  The danger, of course, is that the company goes through hard times and you lose both your job and a substantial portion of your wealth.   Employees of once high-flying companies like Enron, Lehman Brothers, Blackberry, GE and many more can testify to the risks involved with owning too much company stock.

Managing Risk

At the end of the day, correlation and diversification are all about risk.  Early in one’s career as you are building wealth and have a long horizon, there is less concern about risk because there is less to lose and more time to recover.  As one approaches and enters retirement, however, managing risk becomes very important because there is usually more to lose and less time to recover.  This means it is critical to have a well-diversified portfolio whose assets aren’t highly correlated.

If you’re concerned about portfolio diversification, please call our office to find out how we can help.

It’s All Relative (Performance)

By Scott Roark, MBA, PhD | April 20, 2019

There are plenty of circumstances in life where you really don’t want to compare yourself with others.  Doing that is a fairly reliable way to make yourself feel bad – there will always be someone better looking, more athletic, more successful or richer than you.  But in the world of investing, it is critical to compare the performance of your portfolio to a suitable benchmark.  It gives you a sense of how well you are (or your investment advisor is) doing.

Comparing Yourself With Others

The trick in comparing investment performance is to ignore the headline number – absolute performance and instead focus on relative performance.  Absolute performance is simply the return you had – maybe up 7% for the year, or down 4% for the quarter.  Relative performance, on the other hand, compares your investment returns to a suitable benchmark.  The key word there is “suitable” – something else that reflects the characteristics (risk, asset allocation, etc.) of your investment.  So, you wouldn’t want to compare your bond portfolio or your High-Tech mutual fund to the S&P 500 – in both cases, the benchmark doesn’t reflect the nature of your investment.

There are some strange things that can happen when you start looking at relative performance.  First, you can be upset when you have a “decent” absolute return.  Perhaps your balanced mutual fund earned 5% for the quarter.  But if the benchmark for balanced funds is 9%, it is perfectly reasonable to be upset with your “decent” return – you did worse than you should have given the characteristics of your investments.

Stranger still is the situation where you should be happy with a negative return.  This would happen when your portfolio lost (for instance) 8% in value, but comparable investments lost 16%.  If that situation occurs, you are fortunate indeed – even though your value went down.

Let’s Be Reasonable

At the end of the day, you want a return that is reasonable given the investments you have made – what is frequently termed the “risk-adjusted return”.  If you are getting returns close (say within 1%) of an appropriate benchmark, you are doing pretty well.  Unfortunately, many investors – after paying advisor fees, mutual fund fees, and other transaction costs are well below where they “should” be.  And worse still, many of these investors don’t realize that fact.  Next time you are reviewing the performance of your investments, make sure you compare those results to the results of comparable benchmarks.

« Page: 1 2